In today’s competitive business environment, focusing on the customer is absolutely essential for the business growth and prosperity. If we are not able to satisfy all the stated and implied needs of the customers with respect to Quality. Price and Delivery, we will not be able to survive in the market. Closely linked to the idea of customer satisfaction is the concept of operational excellence, which means embracing change and reaching out new and higher standards of performance. This has become a fundamental requirement in any field of business.
The main objective in any business is to make profit. As we all know, profit is the difference between the selling price and the manufacturing cost of the product. For increasing the profit, the selling price should increase and/or the manufacturing cost should come down. Since the price is decided by competition in the market, this can not be increased as we wish. Hence, the only way to increase profit is to cut down the manufacturing cost, which can be achieved only through continuous improvement in the company’s operations. Six sigma Quality Programme provides an over all frame work for continuous improvement in the business processes of an organisation.
Six sigma Quality Programme is defined as a customer-oriented, structured, systematic, proactive, and quantitative company-wide approach for continuous improvement of manufacturing, services, engineering, suppliers and other business processes. It measures the degree to which the process deviates from the goals and then takes efforts to improve the process to achieve total customer satisfaction. The approach was first started in MOTOROLA in 1988. The goal of six sigma programme is two-fold:
Six sigma means several things. First, it is a statistical measurement which tells us how good our products, services and processes really are and enables us to benchmark our operations in order to identifying improvement opportunities. In other words, six sigma helps us to establish our course and gauge our pace in the race for total customer satisfaction. When we say that a process is at six sigma levels, such a process will normally yield two instances of non-conformance, provided there is no shift in the process average. The same will yield 3,4 instances of non-conformances out of every million opportunities with an expected shift of 1.5 sigma in the process average. This is considered to be best-in-class quality. A process at four sigma level is considered as an average process, which will yield 6210 instances of non conformances for every million opportunities, with shift in process average (63 without shift). Second, six sigma is business strategy which can generally help us to gain a competitive edge. As the sigma level increases, the product quality improves and costs go down resulting in improved customer satisfaction.
Third, six sigma is philosophy, essentially one of working smarter. The means making fewer and fewer mistakes in everything we do. As we discover and eliminate harmful sources of variation, our-conformances go away, process capability improves and sigma rating goes up
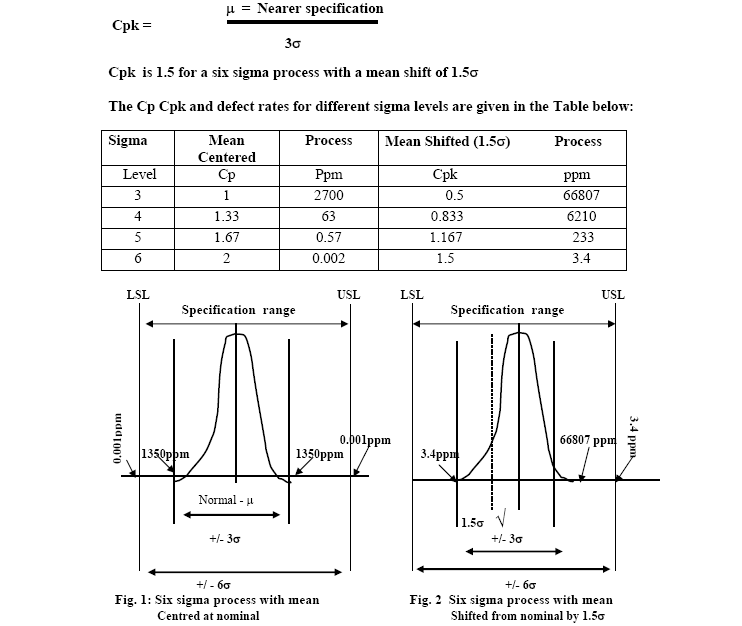
Six sigma relies on the normal distribution theory to predict defect rates. As we all know, variation is inevitable in any process. The variation can be due to change causes that are inherent in the process [change variation) or due to assignable causes and bring the process under the influence of only change causes, then the process is said to be under statistical control. When the process is under statistical control, any measured characteristic will result in a normal distribution. Assume that the measured values follow a normal distribution with mean (μ) and standard deviation ( ). The process capability (PC) is defined as six times the standard deviation. PC represents the measured inherent reproducibility of the product turned out by the process. It gives the inherent process variation. The area under the normal curve within +/3σ of the mean includes 99.73% of all measurements. Suppose also that the mean is centered at the nominal or target value, and the upper specification limit (USL) and lower specification limit (LSL) are respectively at +/3σ of the mean. This is a three sigma process, and 99.73% of all measurements. Suppose also that the mean is centered at the nominal or target value, and the upper specification limit (USL) and lower specification limit (LSL) are respectively at +/3σ of the mean. This is a three sigma process, and 99.73% of all measurements are within specification conversely, 0.27% (2700 parts per million) are outside the specification (Refer figure 1)
A tour sigma process will have USL and LSL of + 4σ of the mean. Such a process has a defect rate of 63 ppm. Similarly, a six sigma process will have USL and LSL of +/ 6σ of the mean with a defect rate of 0.002 ppm (Refer Figure 1)
The process capability index Cp is defined as the ratio of specification width of PC
Cp = USL – LSL
6σ
Cp is 2 for a six sigma process. This means that the inherent process variation is half of the specification width.
So far we have assumed that the process mean in centered at the nominal. However, in the real world, the process mean might become displaced from nominal. The displacement might occur as the result of a slow drift (such as from tool wear) or as the result of a sudden shift in the mean (such as from a bad set up). Experience shows that an average mean shift of 1.5σ could be expected in practice. A six sigma process with a mean shift of 1.5σ will have defect rate of 3.4 ppm (Refer figure 2). The PC index for a process with shifted mean is denoted as Cpk and is defined as the ratio of the absolute distance from the mean to the nearer specification to one-half the inherent process variation.
The discussions so far were based on a single part or process characteristic. In practice, most of the delivered products or services will have multiple parts and / or process steps, which represent opportunities for non-conformities or defects. For example, a watch has numerous parts and assembly steps. In such cases, it is important to ask questions such as what is the distribution of defects, how many units can be expected to have zero defects, one defect, two defects and so on for a given ppm, what will be the defect rates and sigma levels for individual parts and process steps that contribution to the total unit with a given defect rate and what will be the process yield for the completed units if the individual defect opportunities and defect rates per opportunities for each unit are known.
Let us suppose that the Quality records related to an item manufactured show the number of observed non-conformities as “d” out of the total number of units produced “u”. Assuming that the defect opportunities are independent and the defects are randomly distributed, the Defect per Unit (DPU) is computed as
d
DPU = ------
u
If each unit manufactured has got “m” number of opportunities for non conformance, we can compute the Defects Per Opportunity (DPO) as
DPU
DPO = ------
m
In the calculation of DPO, we are taking into consideration only the active opportunities (those which are getting measured) and not the passive opportunities (which are not getting measured) within each unit.
From this, the DPMO can be computed as
The sigma level can be found out from the DPMO value using Statistical Tables. If the DPMO and the number of defect opportunities are known for each contributing step the total DPMO for the completed unit can be computed as follows.
Expected defects (ppm for each step) = DPMO x Number of opportunities (for each step)
Expected defects (ppm for completed unit) – Sum of expected defects of (individual steps)
DPMO (for completed unit) = Expected defects (ppm for completed unit)
Total
The process YIELD (FIRST TIME YIELD) Represent the proportion of defect-free units before testing or repair. The Poisson distribution can be used to calculate the YIELD for a unit the DPU value is known.
![]()
If the yield is know for each part or process step, the overall yield for the process (ROLLED THROUGHPUT YIELD [YRT] can be computed as the products of yields of individual process steps. This value will be less than the smallest individual yield since these are all in fractions. The clearly shows that for improving the YRT, the individual yield shall be improved. In other words, for minimizing the overall defect rate, the individual defect rates of each part or process step shall be minimised. Hence only with six sigma parts and process steps, will an organisation experience high YRT of complex products with numerous parts and process steps.
The sigma of a process, which tells us how capable the process is, can be used to compare similar or dissimilar processes. Such comparison, known as Benchmarking, will uncover what we do well and not so good. Once the basic competencies and deficiencies are known, corrective action can be taken which leads to the reduction of defects, cycle- time and cost.
In the six sigma approach, the key elements involved are the following:
There are several key assumptions in the six sigma programme. The most significant assumption is that each process parameter can be characterized by a normal distribution. The capacity indices and sigma levels are based on this assumption. However, in the real world, there can be many situations where non-normal distributions are present. In such cases, the actual defect rates might be significantly higher than the predicted defect rates. Therefore, non-normal distributions are likely to lead to unexpected erroneous results.
A second assumption is that a 1.5σ shift in the process mean from the nominal is likely to occur, and the design goal of six sigma processes (Cpk = 1.5) is necessary to provide safe margin against such shifts. It is also generally assumed that six sigma processes are under statistical control. In such a case, it is likely that the shift in process mean will get detected at the first opportunity or soon thereafter. Hence, it may not always be necessary to assume the mean shift. Of course, assuming shifted processes a robust design that ensures six sigma results.
Another assumption is that the process mean and standard deviations are known, and Cp & Cpk are parameters with point values. In reality, the mean and sigma are normally estimated from sample statistics and so, the capability indices are subject to sampling variability. Hence, the capability indices shall be regarded only as rough indicators and not as hard measure of quality, especially where small samples (less than 100) are used.
A final assumption is that defects are randomly distributed throughout units, and parts and process steps are independent of each other. This may not always be true, in which case, the use of Poisson distribution for computing the defect rates and process yields might become invalid.
Even through these assumption and the possible pitfalls do not invalidate the six sigma programmes, the personnel using the six sigma measures shall be aware of the assumptions made so that they can guard against the potential pitfalls.
The term “sigma” is used to designate the distribution –or the spread about the mean of any process. Sigma measures the capability of the process to perform defect-free work. A defect is anything that results in customer dissatisfaction. For a business process, the sigma value is a metric that indicates how well that performing. Higher sigma level indicates less likelihood of producing defects and hence better performance.
Six sigma is a performance standard to achieve operational excellence. With six sigma, the common measurement index is “defects-per-unit” where a unit can be virtually anything a component, piece of material, administrative form, book, distance, time frame etc. Conceptually, six sigma is defined a staying within half the expected range around the target. The approach aims at continuous improvement in all the processes within the organisation. This works on the belief that Quality is free, in that the move we work towards zero-defect production, the more return on investment we will have. The advantages of six sigma approaches are reduction in defects/rejections, cycle time, work in progress etc. and increase in product Quality & Reliability, customer satisfaction, productivity etc. leading ultimately to excellent business results.