Coal dominates the energy mix in India, contributing to 55% of the total primary energy production. Over the years, there has been a marked increase in the share of natural gas in primary energy production from 10% in 1994 to 13% in 1999. There has been a decline in the share of oil in primary energy production from 20% to 17% during the same period. .
India has huge coal reserves, at least 84,396 million tonnes of proven recoverable reserves (at the end of 2003). This amounts to almost 8.6% of the world reserves and it may last for about 230 years at the current Reserve to Production (R/P) ratio. In contrast, the world’s proven coal reserves are expected to last only for 192 years at the current R/P ratio.
Reserves/Production (R/P) ratio- If the reserves remaining at the end of the year are divided by the production in that year, the result is the length of time that the remaining reserves would last if production were to continue at that level.
India is the fourth largest producer of coal and lignite in the world. Coal production is concentrated in these states (Andhra Pradesh, Uttar Pradesh, Bihar, Madhya Pradesh, Maharashtra, Orissa, Jharkhand, West Bengal).
Oil accounts for about 36 % of India's total energy consumption. India today is one of the top ten oil- guzzling nations in the world and will soon overtake korea as the third largest consumer of oil in Asia after China and Japan. The country’sannualcrudeoil production is peaked at about 32 million tonne as against the current peak demand of about 110 million tonnes.
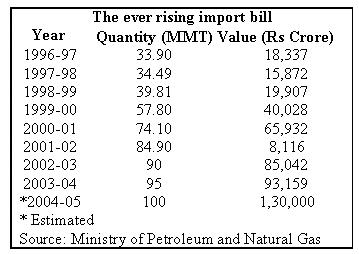
In the current scenario, India’s oil consumption by end of 2007 is expected to reach 136 million tonne(MT), of which domestic production will be only 34 MT. India will have to pay an oil bill of roughly $50 billion, assuming a weighted average price of $50 per barrel of crude. In 2003-04, against total export of $64 billion, oil imports accounted for $21 billion. India imports 70% of its crude needs mainly from gulf nations. The majority of India's roughly 5.4 billion barrels in oil reserves are located in the Bombay High, upper Assam, Cambay, Krishna-Godavari. In terms of sector wise petroleum product consumption, transport accounts for 42% followed by domestic and industry with 24% and 24% respectively. India spent more than Rs.1,10,000 crore on oil imports at the end of 2004.
Natural gas accounts for about 8.9 per cent of energy consumption in the country. The current demand for natural gas is about 96 million cubic metres per day (mcmd) as against availability of 67 mcmd. By 2007, the demand is expected to be around 200 mcmd. Natural gas reserves are estimated at 660 billion cubic meters.
The all India installed capacity of electric power generating stations under utilities was 1,12,581 MW as on 31st May 2004, consisting of 28,860 MW- hydro, 77,931 MW - thermal and 2,720 MW- nuclear and 1,869 MW- wind (Ministry of Power). The gross generation of power in the year 2002-2003 stood at 531 billion units (kWh).
Nuclear Power contributes to about 2.4 per cent of electricity generated in India. India has ten nuclear power reactors at five nuclear power stations producing electricity. More nuclear reactors have also been approved for construction.
India is endowed with a vast and viable hydro potential for power generation of which only 15% has been harnessed so far. The share of hydropower in the country’s total generated units has steadily decreased and it presently stands at 25% as on 31st May 2004. It is assessed that exploitable potential at 60% load factor is 84,000 MW.
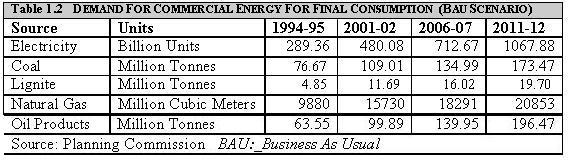
Final energy consumption is the actual energy demand at the user end. This is the difference between primary energy consumption and the losses that takes place in transport, transmission & distribution and refinement. The actual final energy consumption (past and projected) is given in Table 1.2.
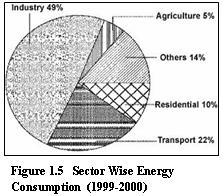
The major commercial energy consuming sectors in the country are classified as shown in the Figure 1.5. As seen from the figure, industry remains the biggest consumer of commercial energy and its share in the overall consumption is 49%. (Reference year: 1999/2000)
Economic growth is desirable for developing countries, and energy is essential for economic growth. However, the relationship between economic growth and increased energy demand is not always a straightforward linear one. For example, under present conditions, 6% increase in India's Gross Domestic Product (GDP) would impose an increased demand of 9 % on its energy sector.
In this context, the ratio of energy demand to GDP is a useful indicator. A high ratio reflects energy dependence and a strong influence of energy on GDP growth. The developed countries, by focusing on energy efficiency and lower energy-intensive routes, maintain their energy to GDP ratios at values of less than 1. The ratios for developing countries are much higher.
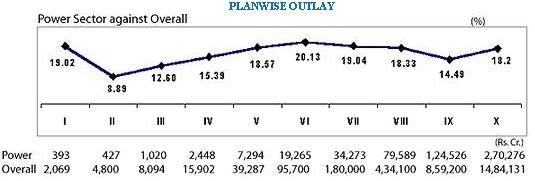
The plan outlay vis-à-vis share of energy is given in Figure 1.6. As seen from the Figure, 18.0% of the total five-year plan outlay is spent on the energy sector.
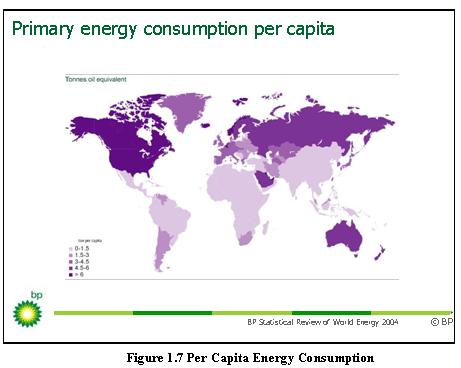
The per capita energy consumption (see Figure 1.7) is too low for India as compared to developed countries. It is just 4% of USA and 20% of the world average. The per capita consumption is likely to grow in India with growth in economy thus increasing the energy demand.
Energy intensity is energy consumption per unit of GDP. Energy intensity indicates the development stage of the country. India’s energy intensity is 3.7 times of Japan, 1.55 times of USA, 1.47 times of Asia and 1.5 times of World average.