
The fundamental goal of energy management is to produce goods and provide services with the least cost and least environmental effect.
The term energy management means many things to many people. One definition of energy management is:
“The judicious and effective use of energy to maximize profits (minimize costs) and enhance competitive positions”
Another comprehensive definition is
“The strategy of adjusting and optimizing energy, using systems and procedures so as to reduce energy requirements per unit of output while holding constant or reducing total costs of producing the output from these systems”
The objective of Energy Management is to achieve and maintain optimum energy procurement and utilisation, throughout the organization and:
Energy Audit is the key to a systematic approach for decision-making in the area of energy management. It attempts to balance the total energy inputs with its use, and serves to identify all the energy streams in a facility. It quantifies energy usage according to its discrete functions. Industrial energy audit is an effective tool in defining and pursuing comprehensive energy management programme. As per the Energy Conservation Act, 2001, Energy Audit is defined as “the verification, monitoring and analysis of use of energy including submission of technical report containing recommendations for improving energy efficiency with cost benefit analysis and an action plan to reduce energy consumption”.
In any industry, the three top operating expenses are often found to be energy (both electrical and thermal), labour and materials. If one were to relate to the manageability of the cost or potential cost savings in each of the above components, energy would invariably emerge as a top ranker, and thus energy management function constitutes a strategic area for cost reduction. Energy Audit will help to understand more about the ways energy and fuel are used in any industry, and help in identifying the areas where waste can occur and where scope for improvement exists.
The Energy Audit would give a positive orientation to the energy cost reduction, preventive maintenance and quality control programmes which are vital for production and utility activities. Such an audit programme will help to keep focus on variations which occur in the energy costs, availability and reliability of supply of energy, decide on appropriate energy mix, identify energy conservation technologies, retrofit for energy conservation equipment etc.
In general, Energy Audit is the translation of conservation ideas into realities, by lending technically feasible solutions with economic and other organizational considerations within a specified time frame.
The primary objective of Energy Audit is to determine ways to reduce energy consumption per unit of product output or to lower operating costs. Energy Audit provides a “ bench-mark” (Reference point) for managing energy in the organization and also provides the basis for planning a more effective use of energy throughout the organization.
The type of Energy Audit to be performed depends on:
Thus Energy Audit can be classified into the following two types.
Preliminary energy audit is a relatively quick exercise to:
Preliminary energy audit is a relatively quick exercise to:
A comprehensive audit provides a detailed energy project implementation plan for a facility, since it evaluates all major energy using systems.
This type of audit offers the most accurate estimate of energy savings and cost. It considers the interactive effects of all projects, accounts for the energy use of all major equipment, and includes detailed energy cost saving calculations and project cost.
In a comprehensive audit, one of the key elements is the energy balance. This is based on an inventory of energy using systems, assumptions of current operating conditions and calculations of energy use. This estimated use is then compared to utility bill charges.
Detailed energy auditing is carried out in three phases: Phase I, II and III.
Phase I - Pre Audit Phase
Phase II - Audit Phase
Phase III - Post Audit Phase
A Guide for Conducting Energy Audit at a Glance
Industry-to-industry, the methodology of Energy Audits needs to be flexible. A comprehensive ten-step methodology for conduct of Energy Audit at field level is presented below. Energy Manager and Energy Auditor may follow these steps to start with and add/change as per their needs and industry types.
A structured methodology to carry out an energy audit is necessary for efficient working. An initial study of the site should always be carried out, as the planning of the procedures necessary for an audit is most important.
Initial Site Visit and Preparation Required for Detailed Auditing
An initial site visit may take one day and gives the Energy Auditor/Engineer an opportunity to meet the personnel concerned, to familiarize him with the site and to assess the procedures necessary to carry out the energy audit.
During the initial site visit the Energy Auditor/Engineer should carry out the following actions: -
The main aims of this visit are: -
Depending on the nature and complexity of the site, a comprehensive audit can take from several weeks to several months to complete. Detailed studies to establish, and investigate, energy and material balances for specific plant departments or items of process equipment are carried out. Whenever possible, checks of plant operations are carried out over extended periods of time, at nights and at weekends as well as during normal daytime working hours, to ensure that nothing is overlooked.
The audit report will include a description of energy inputs and product outputs by major department or by major processing function, and will evaluate the efficiency of each step of the manufacturing process. Means of improving these efficiencies will be listed, and at least a preliminary assessment of the cost of the improvements will be made to indicate the expected payback on any capital investment needed. The audit report should conclude with specific recommendations for detailed engineering studies and feasibility analyses, which must then be performed to justify the implementation of those conservation measures that require investments.
The information to be collected during the detailed audit includes: -
Existing baseline information and reports are useful to get consumption pattern, production cost and productivity levels in terms of product per raw material inputs. The audit team should collect the following baseline data:
Draw process flow diagram and list process steps; identify waste streams and obvious energy wastage
An overview of unit operations, important process steps, areas of material and energy use and sources of waste generation should be gathered and should be represented in a flowchart as shown in the figure below. Existing drawings, records and shop floor walk through will help in making this flow chart. Simultaneously the team should identify the various inputs & output streams at each process step.
Example: A flowchart of Penicillin-G manufacturing is given in the figure3.1 below. Note that waste stream (Mycelium) and obvious energy wastes such as condensate drained and steam leakages have been identified in this flow chart
The audit focus area depends on several issues like consumption of input resources, energy efficiency potential, impact of process step on entire process or intensity of waste generation / energy consumption. In the above process, the unit operations such as germinator, pre-fermentor, fermentor, and extraction are the major conservation potential areas identified.

Fuel substitution: Identifying the appropriate fuel for efficient energy conversion
Energy generation :Identifying Efficiency opportunities in energy conversion equipment/utility such as captive power generation, steam generation in boilers, thermic fluid heating, optimal loading of DG sets, minimum excess air combustion with boilers/thermic fluid heating, optimising existing efficiencies, efficienct energy conversion equipment, biomass gasifiers, Cogeneration, high efficiency DG sets, etc.
Energy distribution: Identifying Efficiency opportunities network such as transformers, cables, switchgears and power factor improvement in electrical systems and chilled water, cooling water, hot water, compressed air, Etc.
Energy usage by processes: This is where the major opportunity for improvement and many of them are hidden. Process analysis is useful tool for process integration measures.
Technical and Economic feasibility
The technical feasibility should address the following issues
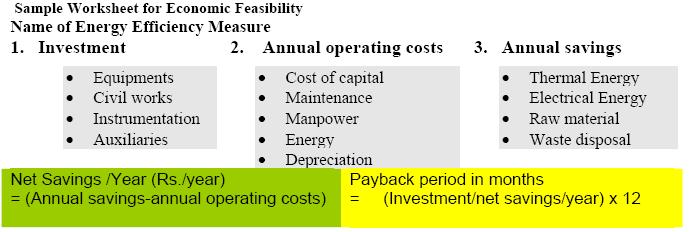
The Economic viability often becomes the key parameter for the management acceptance. The economic analysis can be conducted by using a variety of methods. Example: Pay back method, Internal Rate of Return method, Net Present Value method etc. For low investment short duration measures, which have attractive economic viability, simplest of the methods, payback is usually sufficient. A sample worksheet for assessing economic feasibility is provided below:
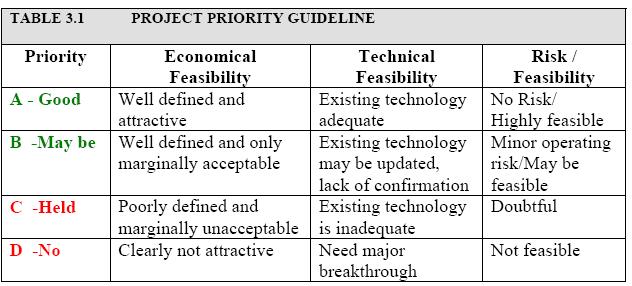
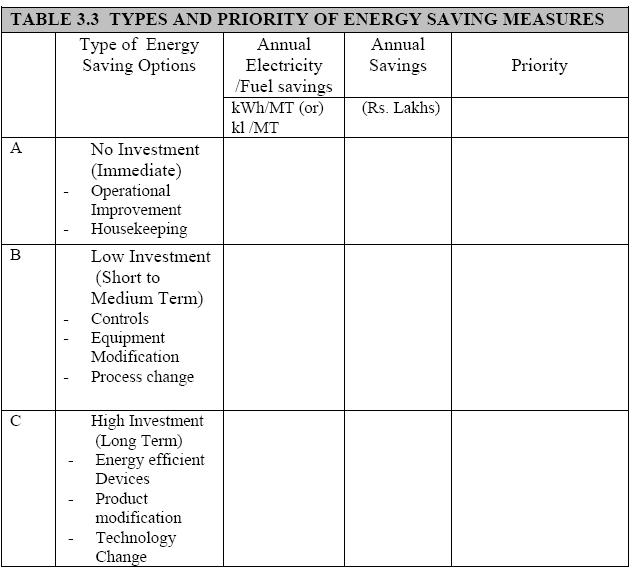
Based on energy audit and analyses of the plant, a number of potential energy saving projects may be identified. These may be classified into three categories:
Normally the low cost – high return projects receive priority. Other projects have to be analyzed, engineered and budgeted for implementation in a phased manner. Projects relating to energy cascading and process changes almost always involve high costs coupled with high returns, and may require careful scrutiny before funds can be committed. These projects are generally complex and may require long lead times before they can be implemented. Refer Table 3.1 for project priority guidelines.
After successfully carried out energy audit energy manager/energy auditor should report to the top management for effective communication and implementation. A typical energy audit reporting contents and format are given below. The following format is applicable for most of the industries. However the format can be suitably modified for specific requirement applicable for a particular type of industry.

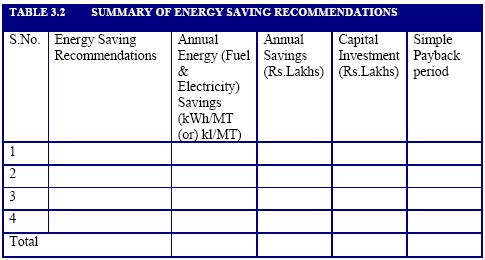
The following Worksheets (refer Table 3.2 & Table 3.3) can be used as guidance for energy audit assessment and reporting.
Understanding energy cost is vital factor for awareness creation and saving calculation. In many industries sufficient meters may not be available to measure all the energy used. In such cases, invoices for fuels and electricity will be useful. The annual company balance sheet is the other sources where fuel cost and power are given with production related information.
Energy invoices can be used for the following purposes:
A wide variety of fuels are available for thermal energy supply. Few are listed below:
Understanding fuel cost is fairly simple and it is purchased in Tons or Kiloliters. Availability, cost and quality are the main three factors that should be considered while purchasing. The following factors should be taken into account during procurement of fuels for energy efficiency and economics.
Electricity price in India not only varies from State to State, but also city to city and consumer to consumer though it does the same work everywhere. Many factors are involved in deciding final cost of purchased electricity such as:
(i.e. How fast the electricity is used? )
(i.e., How much electricity is consumed? )
(i.e. When electricity is utilized ?)
(i.e., Real power use versus Apparent power use factor )
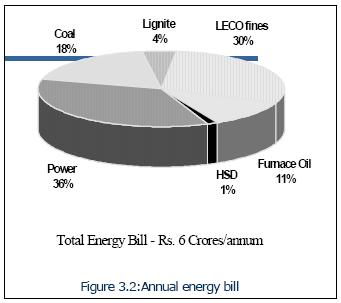
Example: Purchased energy Bill
A typical summary of energy purchased in an industry based on the invoices
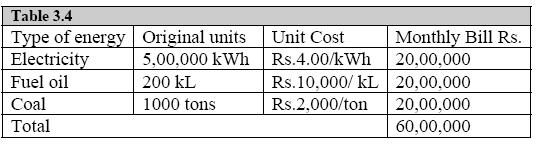
Unfortunately the different forms of energy are sold in different units e.g. kWh of electricity, liters of fuel oil, tonne of coal. To allow comparison of energy quantities these must be converted to a common unit of energy such as kWh, Giga joules, kCals etc.
Electricity(1 kWh) = 860 kCal/kWh (0.0036 GJ)
Heavy fuel oil (Gross calorific value, GCV) =10000 kCal/litre ( 0.0411 GJ/litre)
Coal (Gross calorific value, GCV) =4000 kCal/kg ( 28 GJ/ton)
Benchmarking of energy consumption internally (historical / trend analysis) and externally (across similar industries) are two powerful tools for performance assessment and logical evolution of avenues for improvement. Historical data well documented helps to bring out energy consumption and cost trends month-wise / day-wise. Trend analysis of energy consumption, cost, relevant production features, specific energy consumption, help to understand effects of capacity utilization on energy use efficiency and costs on a broader scale.
External benchmarking relates to inter-unit comparison across a group of similar units. However, it would be important to ascertain similarities, as otherwise findings can be grossly misleading. Few comparative factors, which need to be looked into while benchmarking externally are:
Benchmarking energy performance permits
The benchmark parameters can be:
e.g. kWh/MT clinker or cement produced (cement plant)
e.g. kWh/kg yarn produced (Textile unit)
e.g. kWh/MT, kCal/kg, paper produced (Paper plant)
e.g. kCal/kWh Power produced (Heat rate of a power plant)
e.g. Million kilocals/MT Urea or Ammonia (Fertilizer plant)
e.g. kWh/MT of liquid metal output (in a foundry)
e.g. kW/ton of refrigeration (on Air conditioning plant)
e.g. % thermal efficiency of a boiler plant
e.g. % cooling tower effectiveness in a cooling tower
e.g. kWh/NM3 of compressed air generated
e.g. kWh /litre in a diesel power generation plant.
While such benchmarks are referred to, related crucial process parameters need mentioning for meaningful comparison among peers. For instance, in the above case:
Plant energy performance (PEP) is the measure of whether a plant is now using more or less energy to manufacture its products than it did in the past: a measure of how well the energy management programme is doing. It compares the change in energy consumption from one year to the other considering production output. Plant energy performance monitoring compares plant energy use at a reference year with the subsequent years to determine the improvement that has been made.
However, a plant production output may vary from year to year and the output has a significant bearing on plant energy use. For a meaningful comparison, it is necessary to determine the energy that would have been required to produce this year production output, if the plant had operated in the same way as it did during the reference year. This calculated value can then be compared with the actual value to determine the improvement or deterioration that has taken place since the reference year.
Production factor is used to determine the energy that would have been required to produce this year’s production output if the plant had operated in the same way as it did in the reference year. It is the ratio of production in the current year to that in the reference year.
![]()
The reference year’s energy use that would have been used to produce the current year’s production output may be called the “reference year energy use equivalent” or “reference year equivalent” for short. The reference year equivalent is obtained by multiplying the reference year energy use by the production factor (obtained above)
Reference year equivalent = Reference year energy use x Production factor
The improvement or deterioration from the reference year is called “energy performance” and is a measure of the plant’s energy management progress. It is the reduction or increase in the current year’s energy use over the reference, and is calculated by subtracting the current year’s energy use from the reference years equivalent. The result is divided by the reference year equivalent and multiplied by 100 to obtain a percentage.

The energy performance is the percentage of energy saved at the current rate of use compared to the reference year rate of use. The greater the improvement, the higher the number will be.
Experience however, has shown that once a plant has started measuring yearly energy performance, management wants more frequent performance information in order to monitor and control energy use on an on-going basis. PEP can just as easily be used for monthly reporting as yearly reporting.
Mismatch between equipment capacity and user requirement often leads to inefficiencies due to part load operations, wastages etc. Worst case design, is a designer’s characteristic, while optimization is the energy manager’s mandate and many situations present themselves towards an exercise involving graceful matching of energy equipment capacity to end-use needs. Some examples being:
Once the energy usage and sources are matched properly, the next step is to operate the equipment efficiently through best practices in operation and maintenance as well as judicious technology adoption. Some illustrations in this context are:
Consequent upon fine-tuning the energy use practices, attention is accorded to considerations for minimizing energy input requirements. The range of measures could include:
Fuel substitution: Substituting existing fossil fuel with more efficient and less cost/less polluting fuel such as natural gas, biogas and locally available agro-residues.
Energy is an important input in the production. There are two ways to reduce energy dependency; energy conservation and substitution.
Fuel substitution has taken place in all the major sectors of the Indian economy. Kerosene and Liquefied Petroleum Gas (LPG) have substituted soft coke in residential use.
Few examples of fuel substitution
Few examples of energy substitution