
1.1. We need a means of determining the areas in which a problem lies, that is, whether it is a question of manufacturing efficiency, technology, or the price or marketing of our product. A yardstick that has been developed to measure performance and profitability of the operations is Rate of Return (also known as Return on Investment).
1.2. The analytical tool that is in use is operating return on operating investment (capital employed), with margin of profit on sales and turnover of investment as corollaries. This is one of the most effective, yet simple, techniques conceived to aid both decision making and performance evaluation.
1.3. ROR is the supreme, ultimate and inevitable measurement to which all other measures are subordinate, and into which the results from using other measurements should be converted.
2.1. The formula for ROR is:
% of profit on sales X Capital turnover = Rate of return
OR
This may expressed in graphic form as follows;

2.2. The final' return-on-investment figure is obtained by multiplying a derived per cent of profit on sales by a derived investment turnover. The result is the same as though profits have simply been divided by investment, but the use of the formula adds a factor which ill always informative. Any important change in return on investment can be identified as resetting from a variation in return on sales or a change of substance in investment turnover.
2.3. Considering the three relationships separately, there are three yardsticks return on sales, investment turnover, and return on investment. The different divisions are measured against them individually, because any other practice might be unfair and unrealistic. Some divisions may have large volumes of comparatively low profit defense work; some have large capital investments, any others may lease their plants; some may compete in tight markets, while others may have developed proprietary items that are more or less noncompetitive. Another division may be subject to a cyclical 'demand for its major products over which it has little or no control, or may concentrate on research and development projects which promise much for the future, bu1: return little now. Each division must be judged separately and rated as an entity in its own field of industry.
2.4. Much has been written on the subject of ROR, and there are a number of different definitions and applications in use, particularly with respect to what shallconstitute the investment base. For determining ROR, investment is taken to be operative investment.
3.1. The diagram given below shows the relationship of the operating factors that affect ROR:
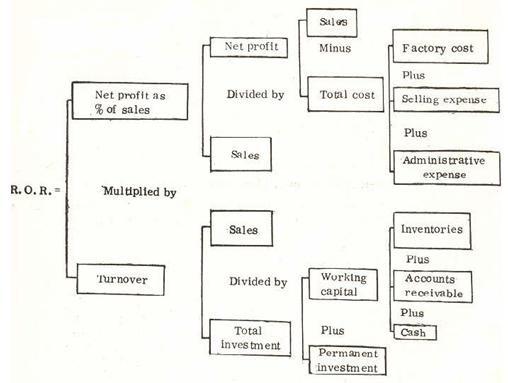
3.2. -A study of the diagram suggests four ways to do this. First, total cost can be reduced. This will increase the operative earnings, and thus return on investment.
3.2.1.., Second, selling prices can be increased, assuming that the price increase will not result in a proportionate drop in sales volu e, and this will increase opera- tive earnings. It will also have the effect of increasing the turnover of total investment with a consequent rise in operative return.
3.2.2. Third, the volume of sales can be increased. This will have the same effect on ROR as will increasing the sales price. The proviso here, of course, is that the increase in sales volume is not the result of a disproportionate increase in promotional or manufacturing costs.
3.3.3. Four, both working capital and permanent investment can be reduced. A decrease in either means a smaller investment base; and, therefore, a higher operative return on that investment. ROR is thus calculated in terms of the money invested in plant and working capital (total capital employed) rather than on equity capital. ROR is simply a technique that top management finds useful in helping it see that operations are properly conducted.
4.1. An illustration to show as to how ROR can be improved by a change in factors affecting ROR is given below:


4.2. Comparing the figures, for the second year with those of the first year, it is found that turnover has increased from 0.7 to 1.19, and net profit as per cent on sales has increased from 14 per cent to 25 per cent, and the important yardstick. of pert romance-ROR-has increased from 10 per cent to 30 per cent, or three times its former level by putting in an additional sum of Rs. 75,000. Such an improvement is not fantastic in chemical industry.
4.3. The following example would explain the application of the ROR formula, and, in the process, its usefulness too:

4.3.1 From this analysis we know that:
4.4. By using the ROR analysis, one is, thus, in a position to discover those factors in the production process which finally determine the actual rate of return; the analysis provides the opportunity for an examination of the various segments of the Company concerned, and for devising suitable adjustments or corrections wherever required.
5.1. ROR is influenced by a variety of aspects like pricing, the speed of circulation of current assets, suitable and economic choice of fixed assets, productivity levels, cost reduction, and technological impact. It would be very difficult for us specifically to categories each of these factors individually contributing to the ROR, but it must be appreciated that they make their impact either individually or collectively.
5.2. It is very important. to appreciate and correlate the two factors, viz., return on capital and corresponding increase in output measured by a suitable parameter like output/capital ratio. It should not be considered futile and unimportant to give a detailed thinking regarding the suitable choice of fixed assets. Approaches to improvement in ROR would necessarily differ from industry to industry.
5.3. In the case of a multi-product industry, trots profitable products should be sleeted, and while deploying capital for the acquisition of fixed assets capital rationing should be adopted.
5.4. Practical reasoning requires not only a ranking to projects according to .3 ladder of profitability, but also a rejection rate-of-return standard to separate projects that are not sufficiently profitable to merit funds from those that are. (Theoretically this cut-off rate of return is automatically determined by the demand and supply schedules for capital. In' practice, however, cut-off rates must be determined by management from 'the frail information available).
5.5. The second use if the rejection rate is to weed out projects that have too Iowa profitability to justify further attention at either divisional or top-management levels. It is thus a tool for economizing executive time.
5.6. The third use is to implement a long-run capital-budgeting plan that seeks to avoid making marginal investment of low productivity in times of .slack investment demand. In this form, the rejection rate, however, required a projection for an integral business cycle of both the total demand curve and the total internal supply curve.
5.7. It is very important that money available with a company is used in productive channels. One of the important factors which contribute to a high velocity of money circulation which is very necessary for improving ROR is the speed of circulation of current assets. In any enterprise, current assets may form items like cash, raw material inventory, work in process stock, finished goods inventory and accounts receivable, etc., and the speed of its circulation will depend noel only on the speed of activities, but also on how effectively the reservoirs of locked up nannies are controlled. In this connexion the illustration on pages 115-116 is self-explanatory, and is valuable to appreciate this aspect.
5.8. Among the many management techniques which contribute in this 'regard, the effective use of the techniques of inventory control, which is a very powerful and potential tool and greatly contributes to the regulation of capital low speed, should be emphasized.
5.9. In recent years, there has been a great deal of interest in finding the 'correct method of calculating ROR. The main methods are the Financial, the Discounted Cash Flow, and the Pay-back. The financial method is the familiar one, and is easy to use. Specifically, ROR accomplishes the following objectives:
6.1. A step-by-step approach as to how ROR may be increased is discussed below.
61.1. First Step-Study the ROR of the firm, say, during the preceding three years: ROR would improve if the capital employed is reduced or utilised more effectively, profit remaining the same, or safes are increased with less percentage increase in variable costs, or capital is reduced by reducing' inventories and investment in accounts receivables and inure effective utilisation of capital assets or both.
6.1.3., Third Step-Arrangement of elements of capital deployment in the order of succession of cost implications: The various areas of the activities of the enterprise absorbing capital are listed in the order of succession of cost implication to gauge their bearing and ,importance for improving the ROR. For instance, in the case of multi-product industry, all products are classified under 3 categories: Category 1those earning a relatively high return; Category II-those earning a modest return; and category III-those earning an unsatisfactory return or showing a loss.
6.1.4. Fourth Step-Rearrangement of elements of capital deployment according to feasibilities of cost reduction: The (l elements listed in the previous step in their succession of cost implications have now to be examined, in tarps of physical practicability for cost reduction. For example, items in Category II, i.e. those earning a modest return, are studied to seek ways by which they might be moved into the more profitable category through some combination of the following approaches:
6.1.4.1. Any commodity or product group in Category III is a drag on the company, since it represents capital and effort that do not provide an adequate return insure future strength, stability, and growth. Therefore, all products in Category III are kept under close scrutiny in an attempt to achieve, as promptly as possible, either a satisfactory rate of profit or elimination of the commodity.
6.1.4.2. Regarding project planning, the total investment necessary for all projects for inclusion in the capital budget should be carefully screened to wed out those which bear no promise of maintaining or improving ROR. For accomplishing this, the proposals are recorded in two major groups as follows:
Since projects in this group do not add to the earning power, they are to be held to a minimum consistent with good plant operation, so that the largest share of the available capital can be used for projects expected to improve the rate of earnings.
Investments in this group can be justified only on the ground that they will improve the company's rate of return, except in those cases where the expenditures are clearly required to maintain the existing rate of return of a commodity which is producing or gives real promise of producing satisfactory results.
6.1.5. Fifth Step-Location of critical areas/or •balancing and improving the performance of each element so as to obtain a more favourable ROR:Various industrial engineering techniques like Work Study, Critical Path Method, Job Evaluation, Preventive Maintenance, Process Control, Inventory Control, and Value Analysis are now applied, as might be relevant, to bring about a more favourable change in the rate of return.